
The Marketing Efficiency & Attribution Playbook: What Today’s CMOs Are Tracking
Insights from a new benchmarking study on how top B2B marketers measure ROI and allocate spend

Have you nailed marketing attribution? Investors want to know how much return they can get on their investment. CEOs want to know how they should allocate budget between marketing, sales, and product to get the biggest return. And marketers want to know the same thing, but by channel or initiative. It’s a complicated question in B2B marketing, where an average deal cycle can be months long and include dozens of touchpoints across sales and marketing.
I covered highlights from the massive Marketing Budget Benchmark I conducted in collaboration with Ray Rike, Jon Miller and Bill Macitis two weeks back. Our goal was to help marketers see “how other folks are doing it.”
Last time I broke down: Marketing as a % of total revenue, Marketing departmental investments, and how companies who invest more in marketing are faster growing. Today I break down our findings on efficiency metrics and attribution tracking.
Key Findings: How CMOs Measure Success
The first question we asked CMOs was “What are your ‘Top Three’ measurements?” Across the board, the most commonly cited metrics were:
Pipeline
Annual Recurring Revenue (ARR)
Marketing Qualified Leads (MQLs)
This suggests that marketing leaders are focused more on volume and pipeline creation than on efficiency metrics like cost per opportunity or marketing CAC (Customer Acquisition Cost).
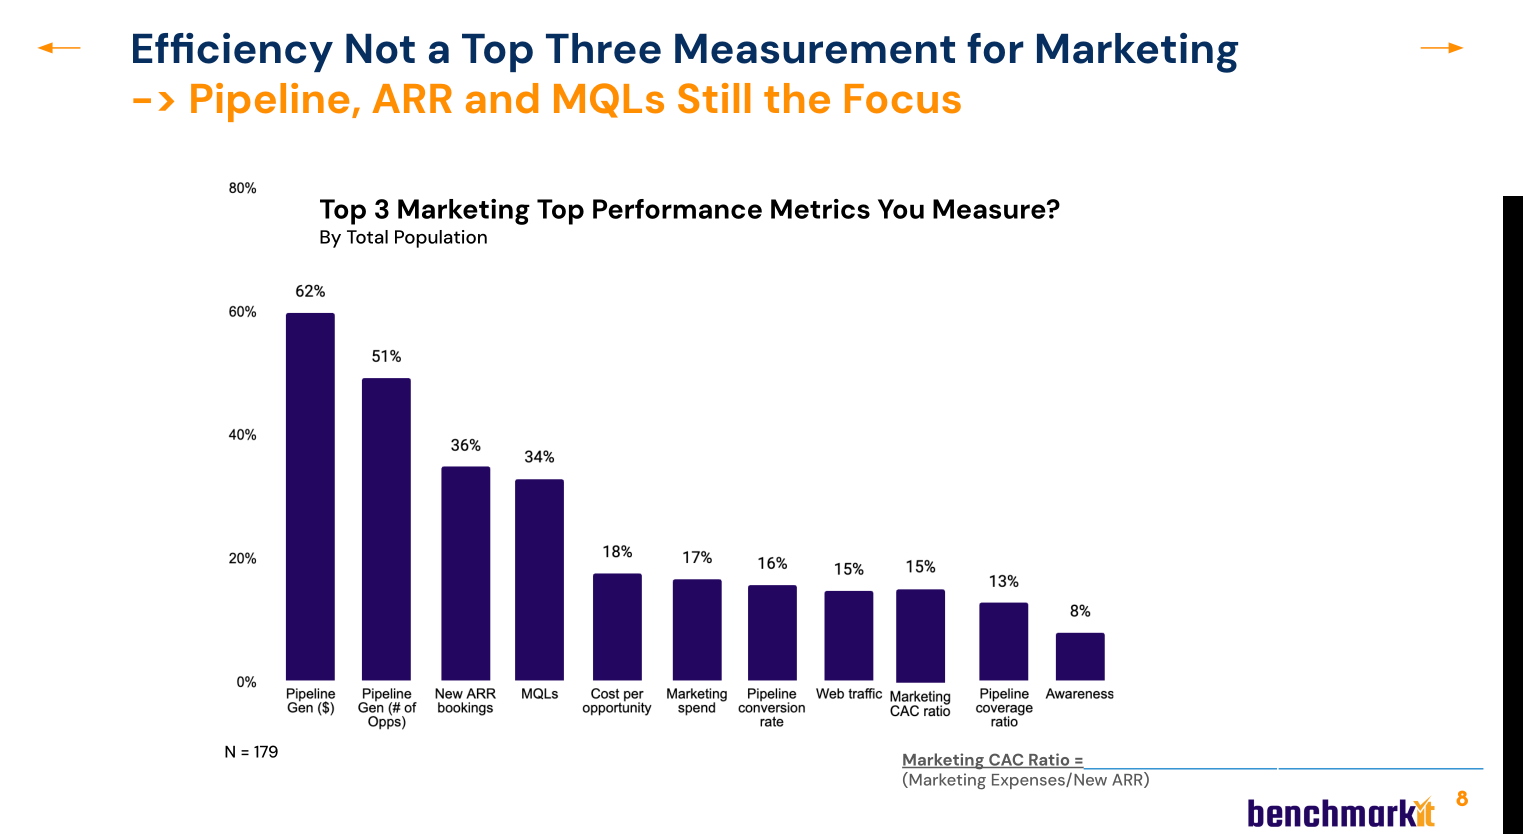
This underscores that marketers are primarily responsible for answering “Are you getting enough” vs. “at what price.”
It’s common that marketers get stuck deep in the weeds of sales/marketing attribution or channel cost/opportunity. But it’s surprising that more aren’t running a blended cost / revenue as a top metric to prove the effectiveness of marketing - and justify future investment.
Which Efficiency Metrics Reign?
While efficiency metrics weren’t top 3, of the folks measuring cost, most were measuring it against pipeline or opportunity, not revenue:
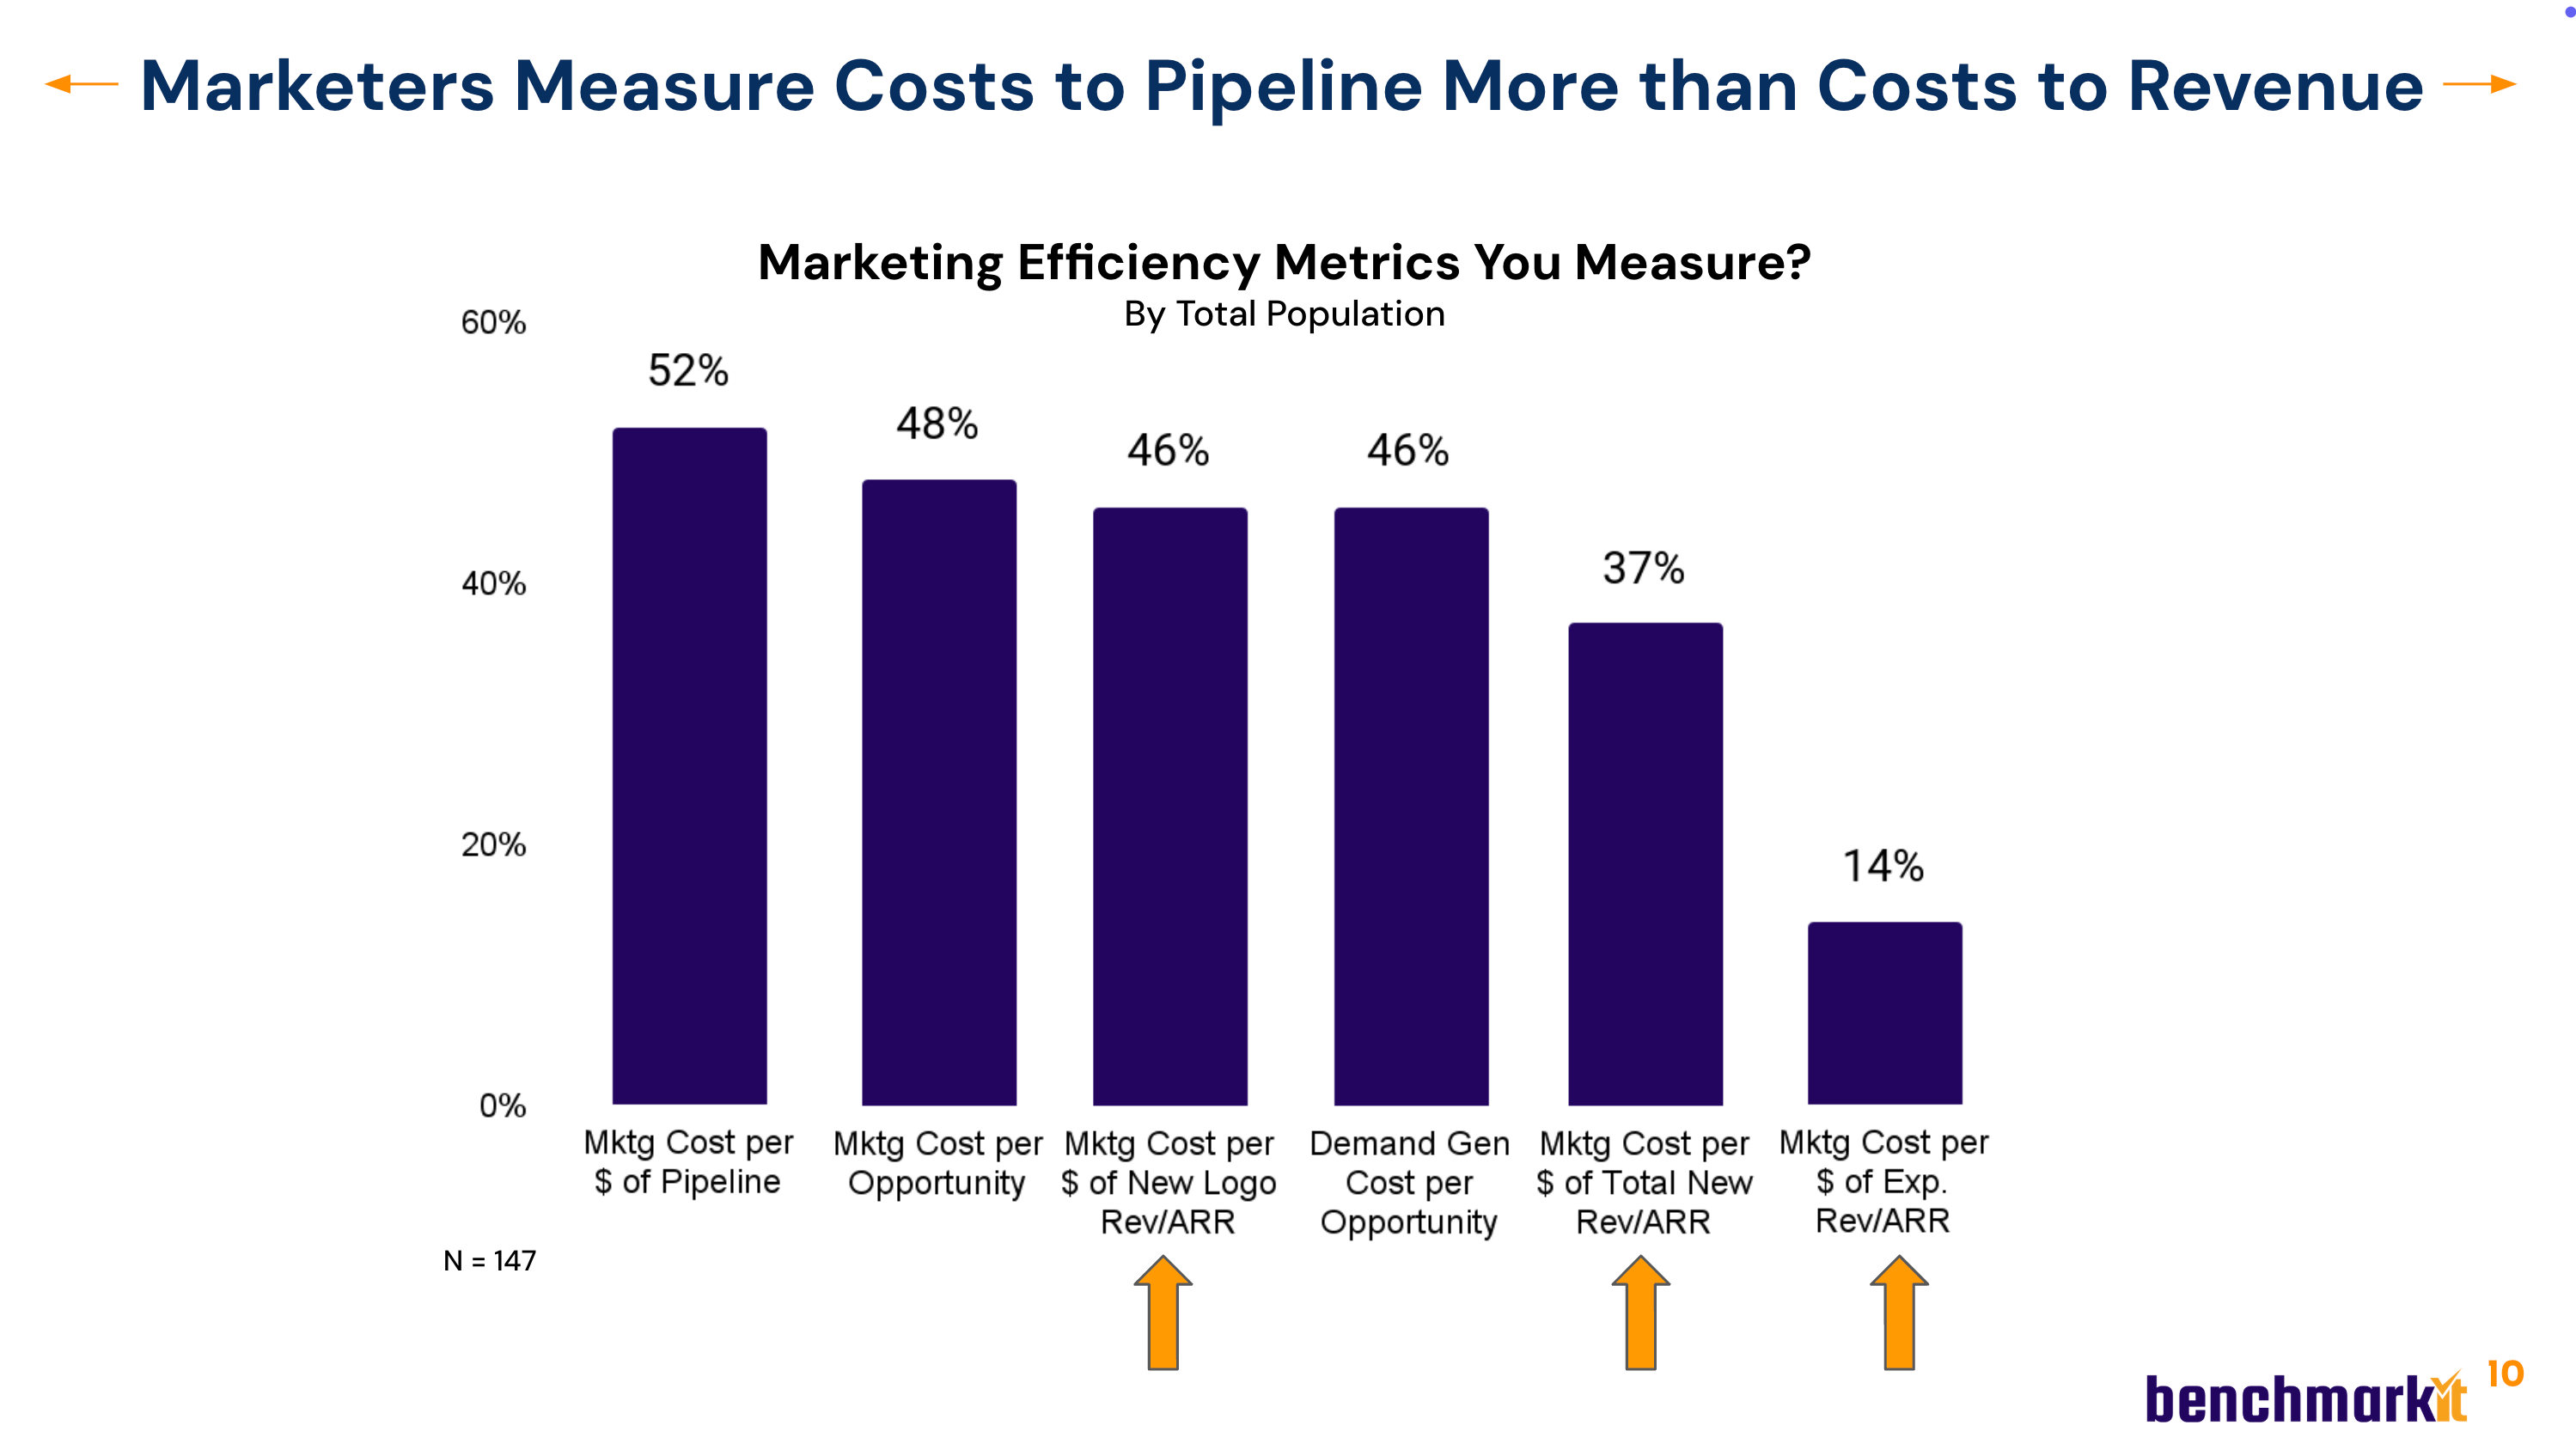
While this is easier, in terms of time delay and volume, these cost measurements can be misleading. Some paid channels can generate a lot of opportunities - but potentially not closed-won deals. While the volume can be much lower, and the time to wait is much longer, cost per revenue is the more reliable, insightful metric.
It was also interesting to note that many marketers aren’t measuring the cost of expansion revenue. In my real-world experience, it’s often difficult to measure all the small things marketing does to support renewal and expansion - and many programs often impact both new revenue and expansion. In practice marketing is often not valued as much as account management support contributions to expansion.
Larger Companies Use Multiple Models
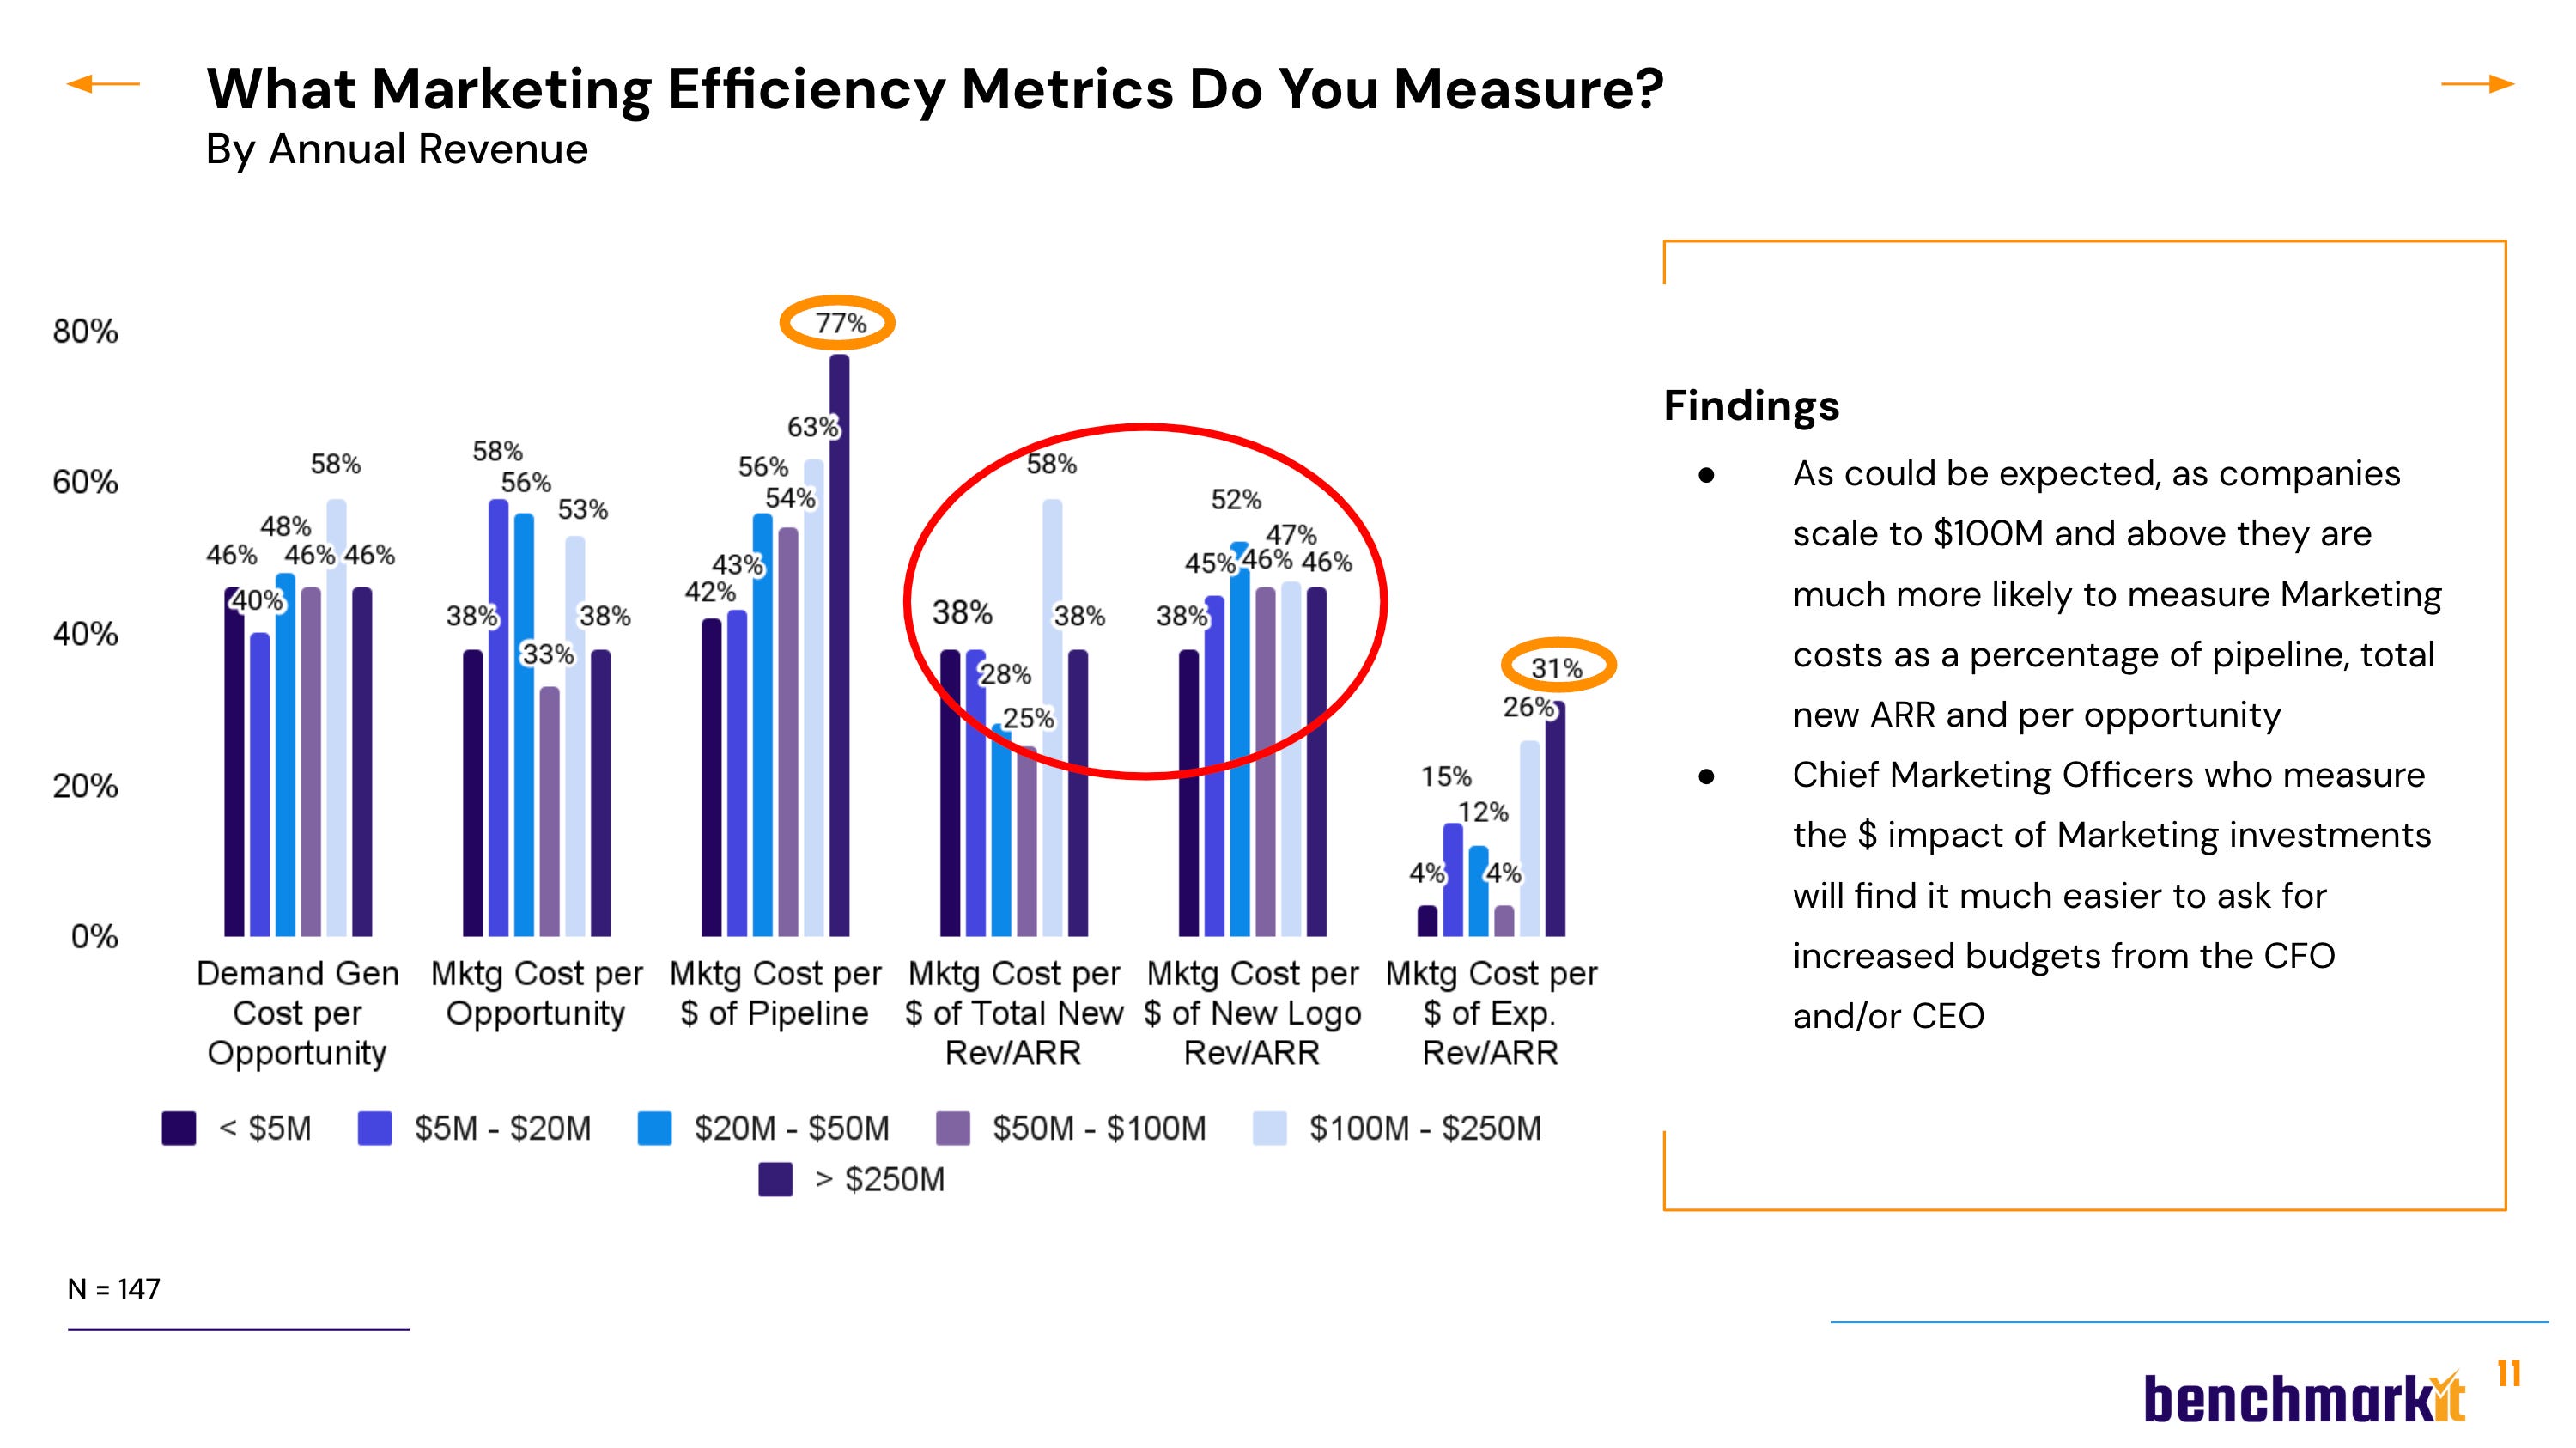
When we looked at the efficiency metrics by company size, we see that:
Bigger companies are more likely to measure cost per dollar of pipeline (tying cost to a $$ number instead of a unit (opportunity)
Bigger companies are more likely to be measuring marketing cost per new logo revenue
Bigger companies are more likely to be tracking cost of expansion revenue:
Breaking Down the Attribution Models
These charts above assume we know “how marketing is contributing” - which in itself is a tricky question. There are several types of attribution models companies use to answer this. Leading with my conclusion, each of these models answers different questions and can / should be used in combination to get directional insights.
First touch attribution - this model captures the moment where a prospect engaged with the company for the very first time (some companies put a time limit on this model - (first touch in the last 6 months), to try to create a recency gate.
Last Touch Attribution - This model captures a prospect's last action before flipping to an opportunity. Many companies (I think inaccurately) believe this action should receive more investment because it’s what “made” the client convert. Many experienced marketers know that it often overweights Google or an SDR call when they ‘collect’ the client nurtured by other marketing touchpoints.
Inbound - Inbound isn’t as much of an attribution model as a type of opportunity - often defined as hand-raisers, demo requests, freemium signups, or people asking for a meeting or engagement. But it’s often tracked and optimized, especially for earlier-stage and lower Average Selling Price (ASP) customers.
Multi-touch - This model captures all of the touches on a prospect’s journey (that receive clicks or cookies) and can allocate cost across them. While it captures all the ways a company secures a customer, cost / activity become very watered down across the whole, and it can’t capture brand investments that lack clicks or cookies.
Marketing Mix Modeling - This model uses statistical regression to analyze historical data and estimate the impact of various marketing investments on revenue and conversions. Unlike digital attribution models that rely on cookies and clicks, MMM includes both online and offline factors, such as brand investments, PR, TV, and even macroeconomic influences. It requires at least two years of data, a significant marketing spend, and works best when a company has a mix of digital and non-digital channels. Some sources suggest MMM becomes valuable at the $50M–$100M+ revenue range, though adoption in tech remains low (under 10%) due to data complexity and resource requirements. See a whole LinkedIn discussion here.
A/B Testing - This isn’t a comprehensive attribution model, but can be used in many ways - for instance, to test different cities or regions against each other to see how different marketing investments create uplift in awareness, opportunities, cost of conversion, or sales.
In our benchmarking survey, we asked companies which model they used, we saw a distinct progression as companies mature:
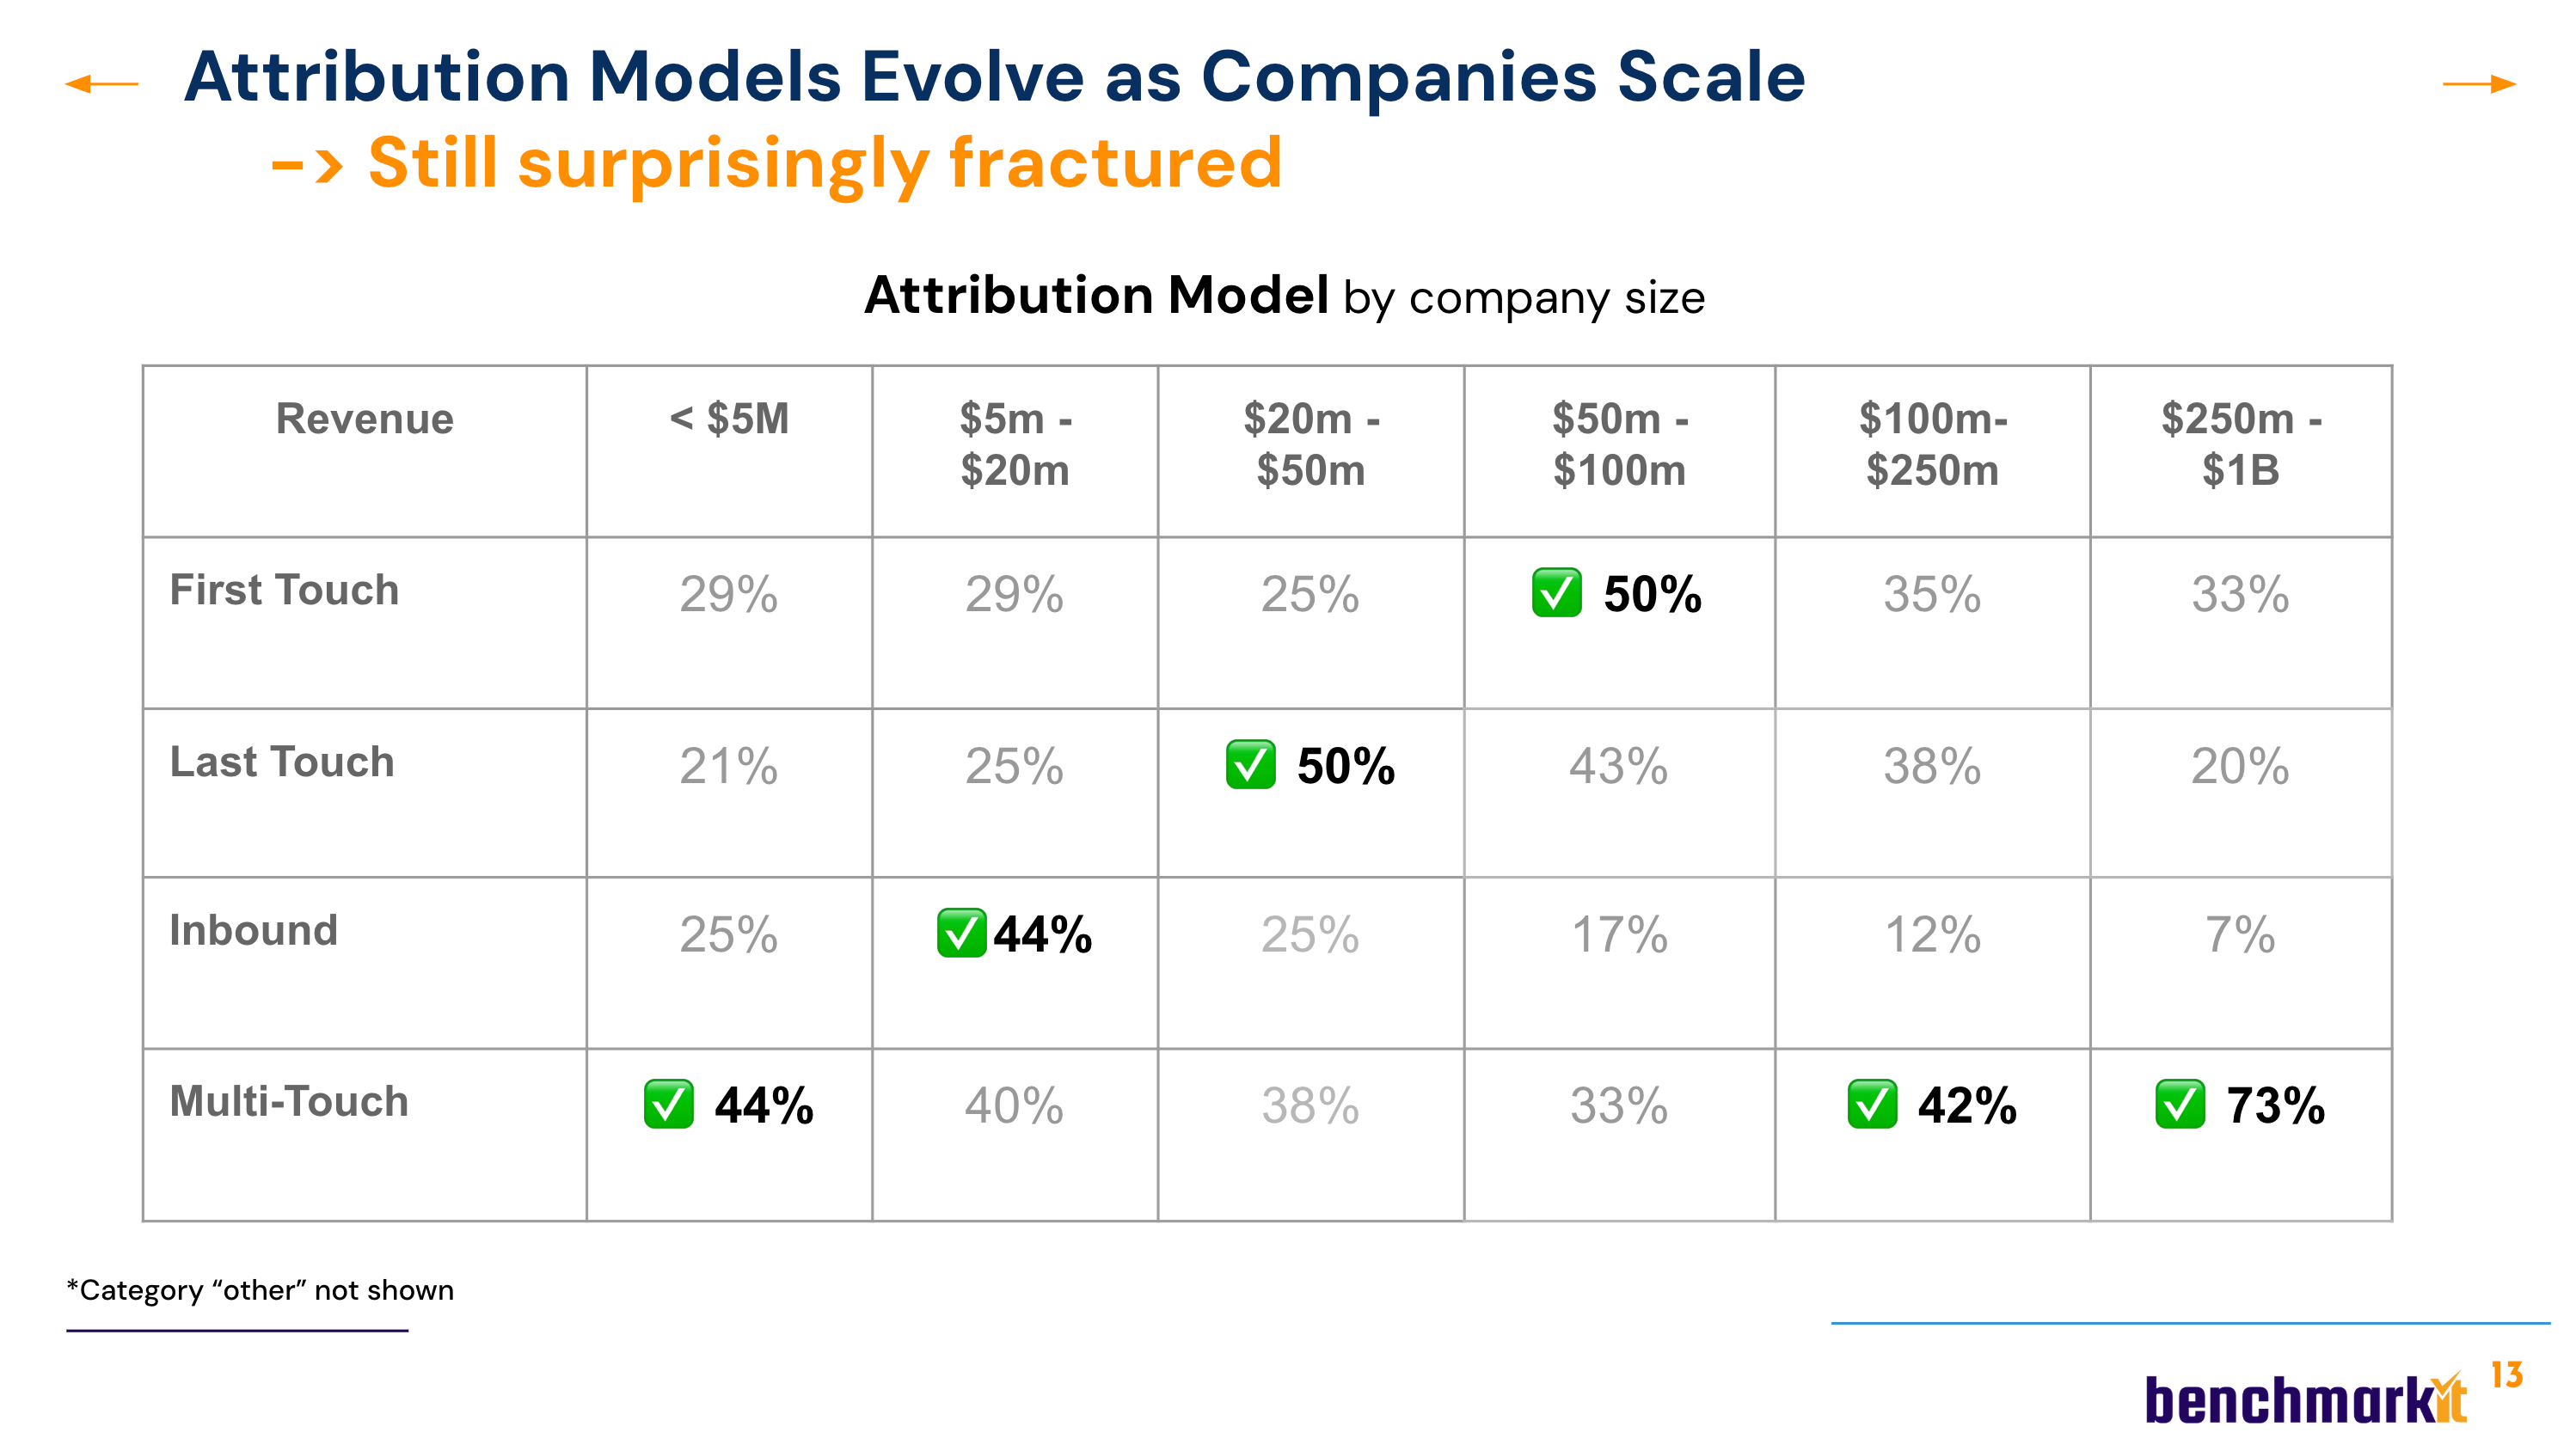
Startups < $5M generally have so few deals that they can inspect a deal end-to-end to see which activities contributed.
Pre-Scale: As companies start to establish product-market fit, they are likely to fill their revenue targets with inbound leads from their network, word-of-mouth, or customer referrals. Inbound is the dominant attribute tracked here.
At scale-up sizes, companies experiment with Last Touch and First Touch - reaping some of the benefits, but ultimately seeing that each is flawed and tells only part of the story. These narrow measurements create the biggest sales-marketing attribution wars as they don’t recognize all the parts working together.
Scaled companies predominantly use Multi-Touch Attribution, which looks at the entire journey. They may also use first and last touch as part of their multi-model strategy to answer different questions: Where do people first find us? Where do we capture them before they convert to opportunity? The combination of these is then used to set investment recommendations and provide blended cost/revenue insights.
We didn’t ask about Marketing Mix Modeling in our survey (we will next time!). But as described above, this model is used by <10% of B2B companies and is used predominantly by larger companies.
Final Thoughts: The Future of Marketing Measurement
While pipeline and ARR remain the priority for marketing success, efficiency metrics are critical for justifying investment. Companies that track cost per revenue rather than just cost per pipeline will have a stronger case for budget allocation and a more accurate picture of what really works - all the way.
Similarly, the best companies are moving beyond single-model attribution to blended approaches. A combination of models can provide both tactical insights and strategic investment guidance.
What’s Next?
There’s so much more to say, but I will have to unpack more about efficiency and marketing attribution in future blogs. If you’re still hungry for more today
See the Marketing Budget Benchmarks webinar, full report, and interactive tool from which this data is extracted here.
Read my deep dive into Marketing Cost of Acquisition Ratios - what they are, why you should use them for planning, and how they will help you communicate better with your CEO and CFO.
Carilu Dietrich is a former CMO, most notably the head of marketing that took Atlassian public. She currently advises CEOs and CMOs of high-growth tech companies. Carilu helps leaders operationalize the chaos of scale, see around corners, and improve marketing and company performance.
It’s worth noting that running MMM’s and econometrics is possible on much lower spend thresholds (especially with advancements being made by teams like https://onesandheroes.com)
But there is the question of return on analytical investment. The era of “not enough data to build a model” is coming to a close (though a lot of traditionalists will likely disagree).
why track MQL instead of a more reliable SQL?