
How to Divide Sales and Marketing Budget in B2B: Benchmarks and Insights
What the latest data says about allocating resources by growth rate, ACV, and company size.

How should budget be divided between sales and marketing? This can be a tough question.
Why Sales Often Wins the Budget Battle
Sales is ‘closer’ to final revenue and often gets credit for the company hitting its revenue number. But if you hire too many salespeople too fast, it can be difficult for marketing and sales outbound efforts to fill the pipeline. And salespeople are very expensive resources.
Especially in B2B, sales cycles can be long and include many touches from sales and marketing - making it difficult to understand exactly what investments help drive the deal (and where more investments should be made.)
So the ratio of sales to marketing spend becomes critical.
The Rule of Thumb: 30% for Marketing
The general “rule of thumb” is that marketing gets 30% of the combined sales and marketing budget. This starting point holds up—until you dig deeper.
A few weeks I covered the top-level findings of a massive Marketing Benchmarks Report. Last week, I covered what the report taught us about marketing attribution. Today, I’m digging into how budget is allocated between sales and marketing through a few different helpful lenses: company size, average contract value, and growth rates. The medians follow the rule of thumb, but the variance is quite interesting. A few percentage points can mean a lot, especially as budgets get bigger.
Budget by Revenue: Smaller Companies Swing Higher
First we looked at the marketing spend broken out by annual revenue. We could quickly see that smaller companies have a much higher range and higher average as they push for early market awareness and consideration. As companies scale, the median settles into the ‘rule of thumb’ 30%, though some companies in teh 50-250M range have as much as 40-50% of the total sales and marketing budget going to marketing.

Budget by Contract Value: Sales Costs Rise With Complexity
Looking at the % of marketing budget by Average Contract Value is more informative. Here we see a pretty distinct trend that lower-cost products have much higher median marketing budgets (36% Marketing / 64% Sales at <$10k)— and conversely, the most expensive products have much higher sales budgets (25% Marketing / 75% Sales at >$250k). This generally makes sense with the philosophy that more salespeople are needed to navigate bigger buying committees, keep long deal cycles moving, and customize an experience for more complex sales. Lower-cost products are often better suited for marketing-driven customer education, self-service, and limited sales support. (In the marketing overview

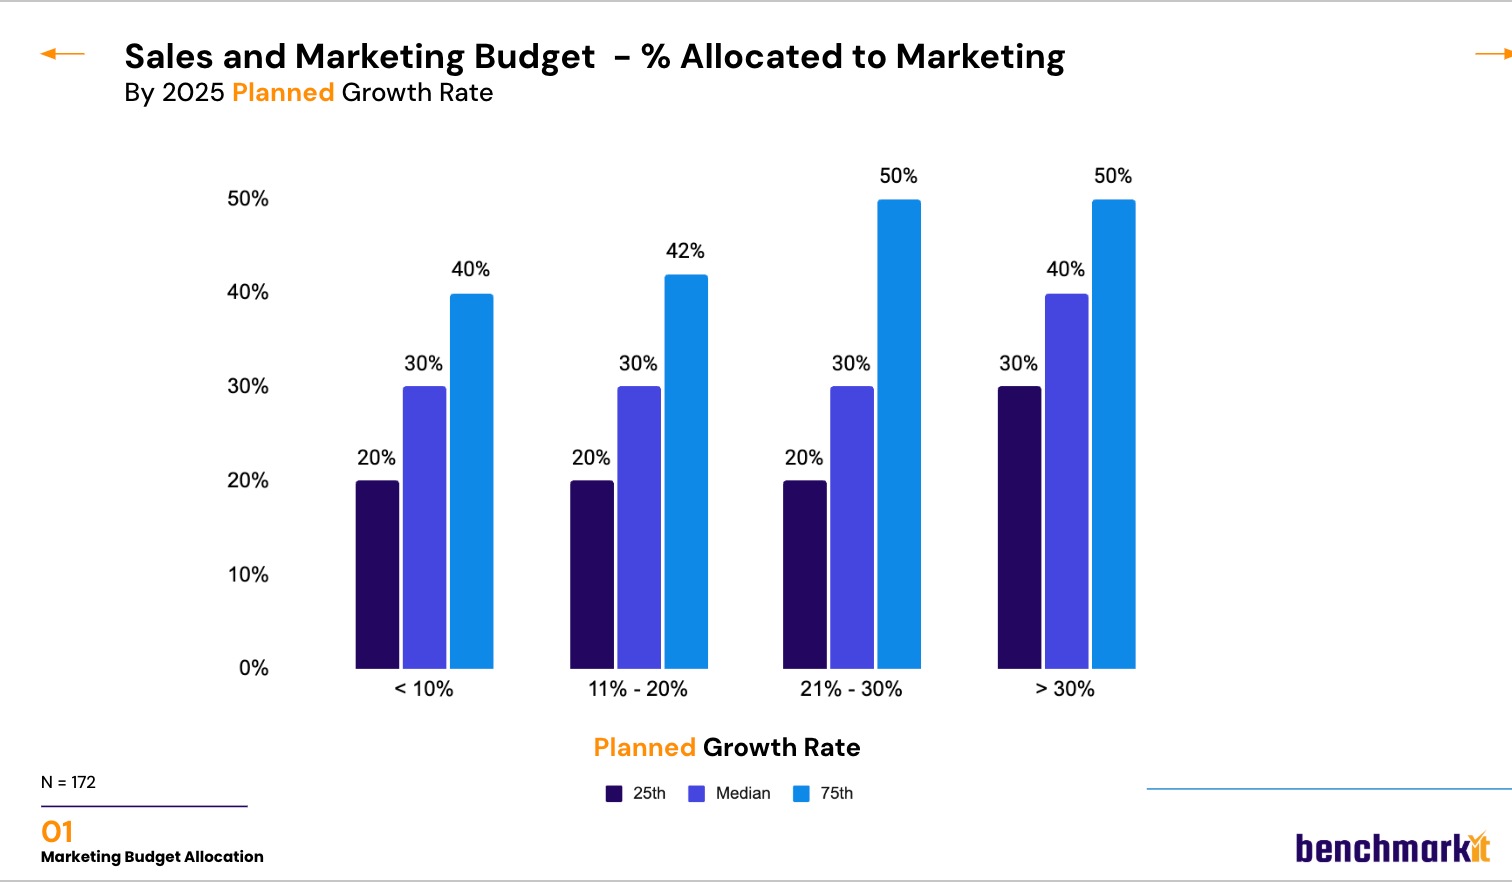
Budget by Growth Rate: Fast-Growing Companies Spend More on Marketing
We then looked at current actuals and planned future spends to see if higher growth companies allocated more to marketing than sales than lower-growth companies (In my marketing benchmark overview I shared data that faster growing companies allocate more to marketing overall) Is this budget coming from the sales allocation?

Here in the Actual growth rate data, we see slight increases in the median allocation to marketing relative to sales for higher growth companies (38% median in the 21%-30% growth range and 33% median in the >30% growth range)
When we looked at the allocation by planned growth rate for next year, we saw less variation, with only the >30% growth companies allocating more budget to marketing on the whole. We still wish we could create a direct causal line between marketing investment and growth, but here again, we see a correlation.
Why This Matters for Internal Budgeting Conversations
For years I listened to public company earnings calls wondering what percent of the overall sales and marketing budget was marketing. Why don’t they break it out separately? I would groan as I tried to benchmark competitors. Little did I know that I could have been using this 30% ‘rule of thumb’ all along.
The data can also be useful for your own internal conversations. As a less experienced marketer, I used only the marketing budget as a percent of revenue - not really considering that the investor and accounting comparisons were often looking at a combined Sales and Marketing allocation. This means that incremental marketing budget I asked for was often going to come from sales versus other parts of the company. Understanding marketing’s ratio to sales and to overall revenue can lead to more strategic accounting conversations.
Final Thought: Use the 30% Rule—Then Adjust Based on Your Reality
Benchmarks are guides, not gospel. They can be incredibly helpful to understand if you’re in the right ballpark. But as we can see above, there are a lot of companies that have made strategic choices to vary from the median. Your market dynamics, go-to-market model, buying audience, company dynamics, and more might influence different strategies. Tailor your spend to your strategy.
Carilu Dietrich is a former CMO, most notably the head of marketing that took Atlassian public. She currently advises CEOs and CMOs of high-growth tech companies. Carilu helps leaders operationalize the chaos of scale, see around corners, and improve marketing and company performance.